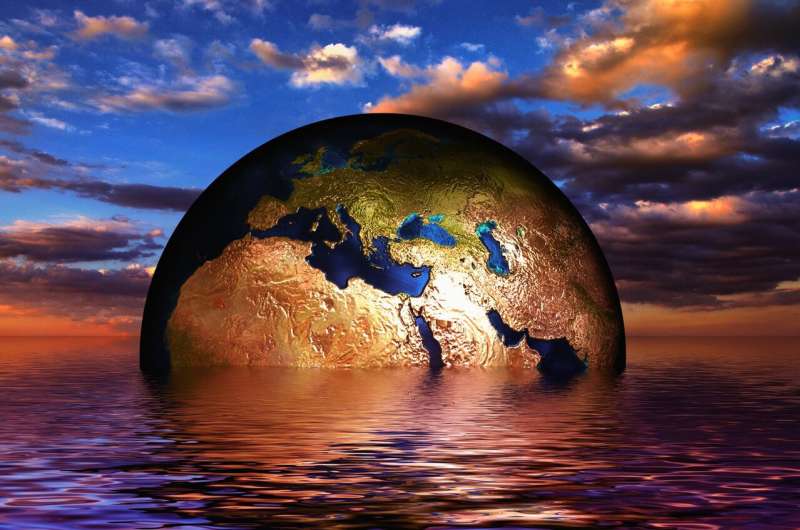
Climate Change: Not My Problem (But Whose Is It?)
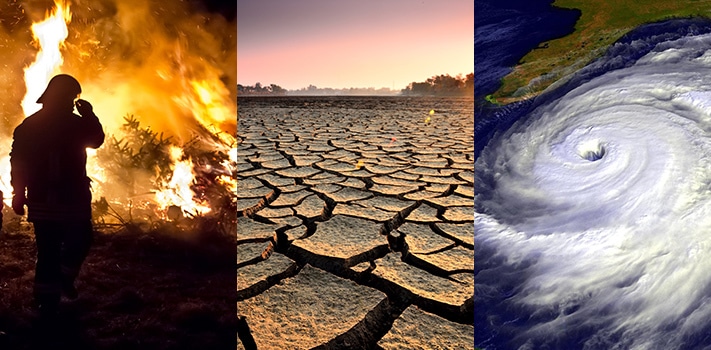
Today, climate change is a well-known fact, but for years it was a hotly debated topic. While there are still some climate deniers, the majority of people have finally accepted the harsh truth that we’re facing. There’s no longer room for debate – we’ve had the 10 warmest years ever recorded since 2005, and hundreds of species are at risk if we continue on this path. We’re at risk to lose entire cities, as increased temperatures cause sea levels to rise.
There have been plenty of warning signs over the years. We can look back at the past century and see exactly what was happening. So, what did the earth look like before climate change? What will it look like in the future? This article will act as a climate time machine, taking you back to look at the changing climate over the years. Then, we’ll consider what these changes mean for us in the present day, what the future looks like, and, perhaps most importantly – whose problem is it, really?
What is Natural Climate Variability?
Most climate change deniers point out the history of temperature changes that the Earth has experienced in its time as a planet. We can say for certain that in the last one million years, the earth has gone through cold periods (ice ages) and warm periods (interglacials) every 100,000 years. Climate change is, to a certain degree, a natural occurrence – the earth goes through its own heating and cooling stages.
However, the cause of these temperature cycles is very different from what we’re experiencing today. Naturally occurring climate change is triggered by small variations in the geometry of how Earth orbits the sun, which in turn changes how much sunlight the Northern Hemisphere gets in the summer. As a result, several feedback loops kick-off, changing the overall temperature and weather conditions. Smaller changes in our climate also occur as a result of solar cycles, volcanic sulfur, plate tectonics, and more.
So, how do we know that there’s a difference between these natural events and the climate change we’re seeing today? Scientists examine ice cores from Greenland and Antarctica, tree rings, glaciers, ocean sediments, changes in the Earth’s orbit of the sun, and pollen remains to study climate change, both natural and human-related. Ice cores in particular provide evidence of the link between rising CO2 levels and rising temperatures. At the same time, we know that we are directly causing the increase in CO2. Over the last 60 years, the annual rate of increase in CO2 in our atmosphere has been about 100 times faster than natural increases we’ve seen in the last million years, like that of the last ice age. This is just one of many indicators that the climate change we are experiencing today is different from the natural climate variability in the earth’s history.
The State of the Environment in Pre-Industrial Times
Under the 2015 Paris Agreement, countries agreed to cut emissions in order to stay “well below” a two-degree Celsius temperature increase above pre-industrial levels. We’ve now set that limit even lower, to 1.5 degrees. (Allen et al., 2018) What’s so important about the pre-industrial temperatures – why should we base our goals around this particular time period? There are a couple of reasons.
First, it gives us a common understanding of where we’re working from, so that all countries are working from a level playing field. More notably, the Industrial Revolution, which began in Britain in the late 1700s and spread around the world from there, marks the beginning of a gradual rise in greenhouse gas emissions. Studies have found that we can look back and see signs of global climate change as early as the 1830s. Pre-industrial temperatures are key because they’re a pre-global warming baseline. They give us a clearer idea of how much CO2 should be in the atmosphere.
Even the Intergovernmental Panel on Climate Change (IPCC) considers the term “pre-industrial” to be ambiguous, meaning that its definition can vary. While this does create some debate, the IPCC uses the reference period of 1850 to 1900 when discussing pre-industrial climate. (Allen et al., 2018) We estimate that in 1850, atmospheric CO2 levels were around 280 parts per million (ppm) – this is our starting point. Today, that number is at about 412 ppm, a huge increase thanks to the industrial boom of the 170 years. Let’s take a look at the other ways that our planet has changed since the Industrial Revolution.
Changes in Sea Ice
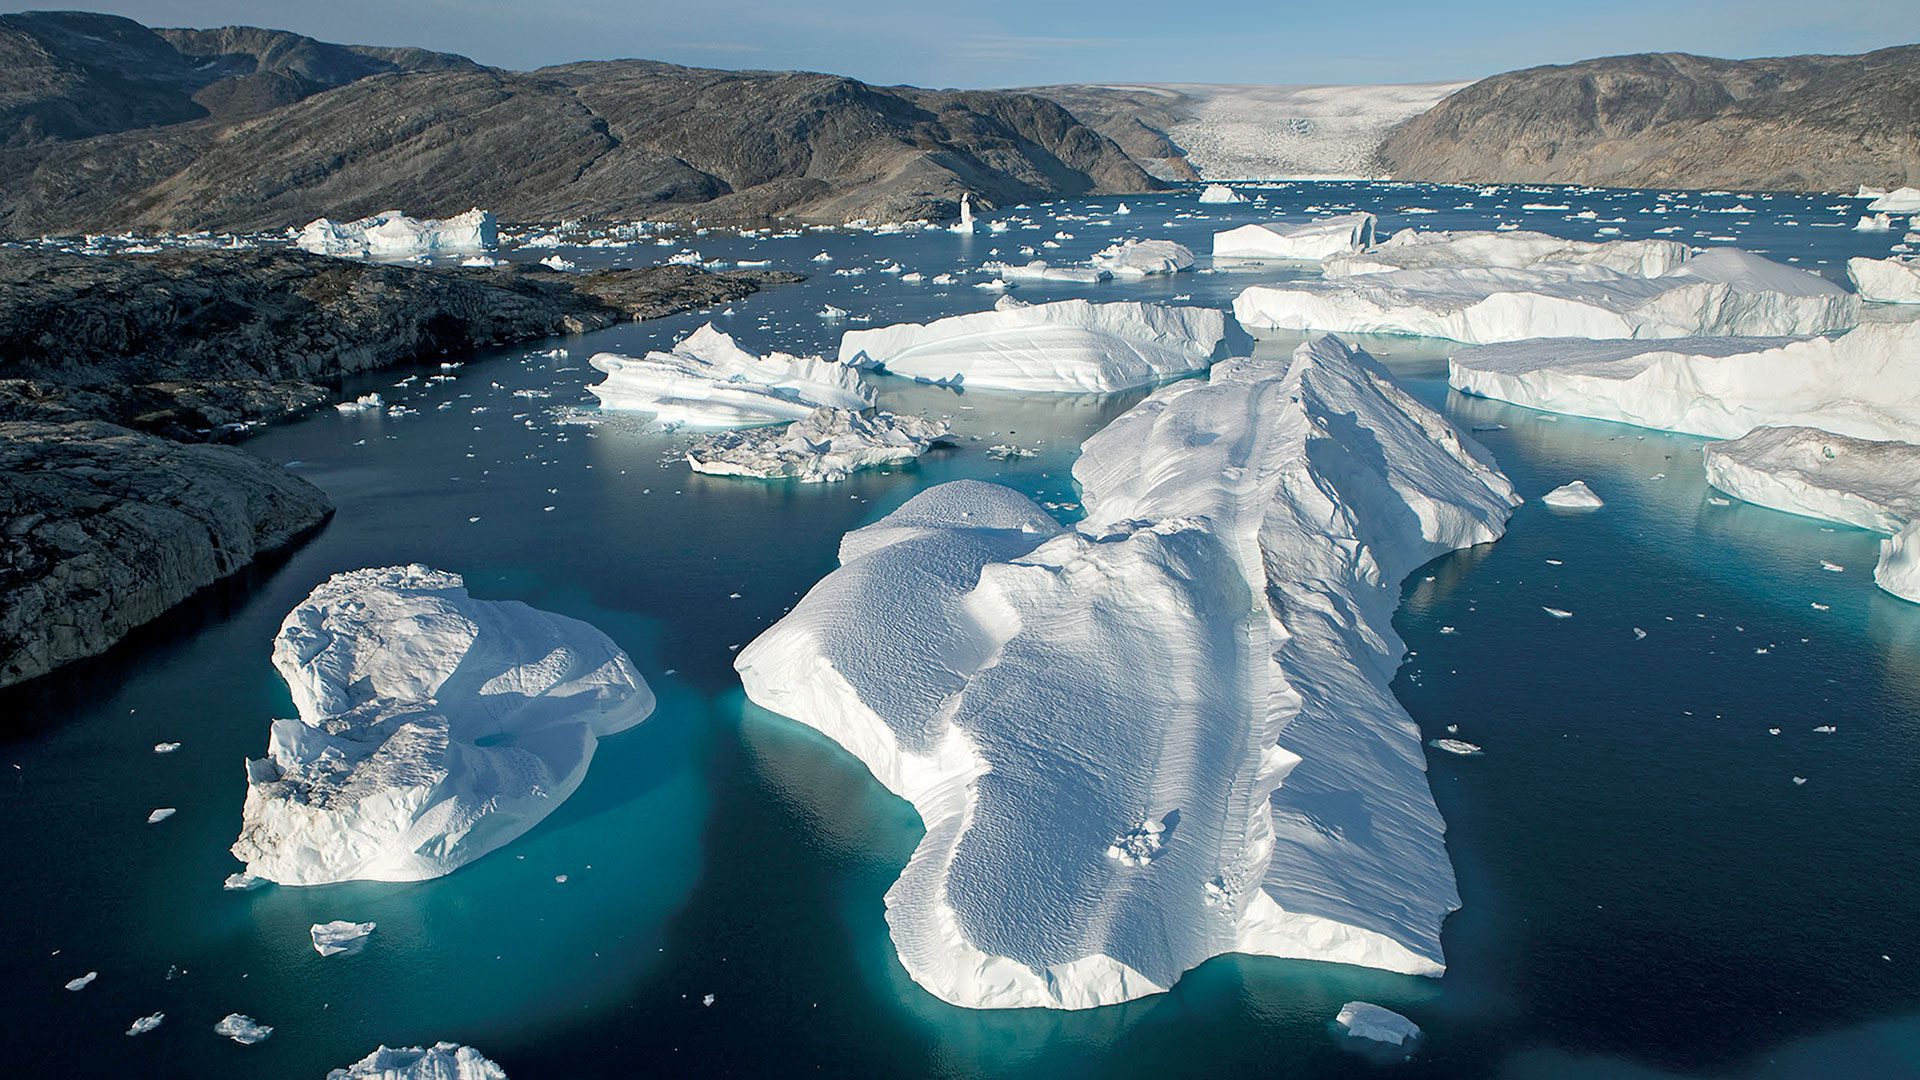
Arctic sea ice remains an important measurement of climate change because of the role it plays in maintaining the earth’s energy balance. The ice is responsible for reflecting sunlight back to space, keeping polar regions cool, and keeping air cool by creating an insulating barrier between the warmer water below the ice and the cold air above it. Arctic sea ice naturally melts and shrinks in the summer and grows in the winter. However, years of tracking the sea ice have shown us that there’s a huge difference in size now compared to just 40 years ago.
As global temperatures rise, so have the temperatures of the water and air. As a result, the amount of sea ice to measure decreases. Not only is the area of ice shrinking, but there is some evidence that the ice has become thinner. Sea ice accumulates over many years, and as it does, it becomes stronger and thicker than newer ice. We’ve lost older sea ice, which tells us that the ice itself is becoming thinner. Additionally, the ice melting season is starting earlier and ending later.
The sea ice cover reaches its minimum at the end of each summer – this is when melting ends and freezing begins. The remaining ice is called perennial ice cover. NASA has tracked perennial ice cover via satellite since 1979, and the perennial ice is clearly shrinking, providing visual evidence of the timeline of climate change.
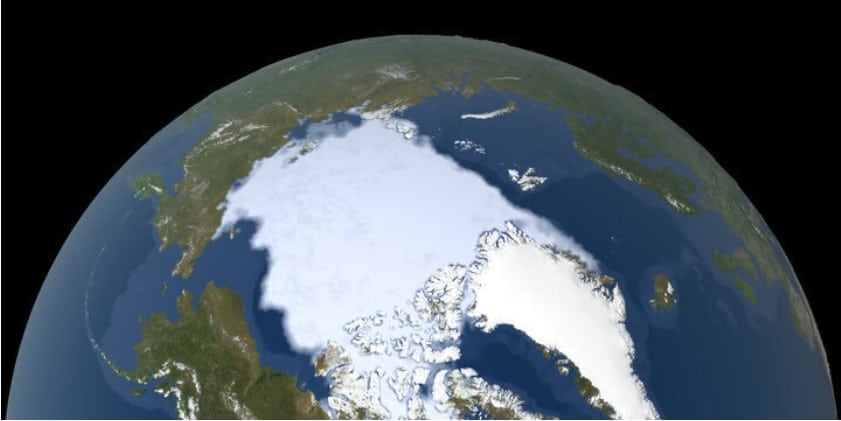
Perennial Ice in 1979. Image via NASA.
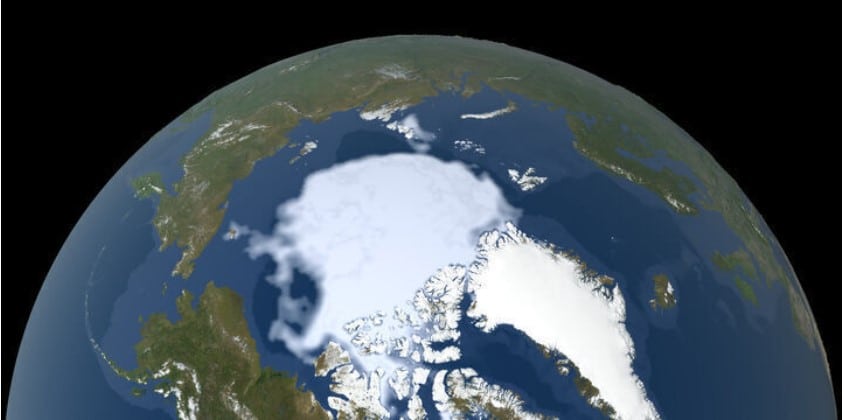
Perennial Ice in 2021. Image via NASA.
Rising Sea Levels
The sea level is another huge indicator of climate change and one that we’ve been tracking for centuries. As you might expect, previous periods of warming have impacted sea levels. For example, the earth warmed about four degrees Celsius between 21,000 and 11,700 years ago, which resulted in the sea level rising 280 feet (85 meters). (How long have sea levels been rising?) Since 1880, and the Industrial Revolution, we’ve seen the sea level rise eight to nine inches. This might not seem huge compared to the last time the sea level rose thousands of years ago, but the sea levels are rising at an alarming speed. The rate at which the sea level rose doubled each year from 2006 to 2015. In 2020, the global sea level had risen 3.6 inches above its level in 1993.
As a result, flooding along the coastline is much more extreme. For example, many locations on the U.S. coastline have high-tide flooding that is 300% to 900% more frequent than it was just five decades ago. If we continue to follow our current path, by 2100 sea levels may rise as much as 8.2 feet (2.5 meters) above the levels in the year 2000. Even if we globally follow a lower greenhouse gas pathway, the sea level will most likely rise 12 inches (0.3 meters) above 2000 levels.
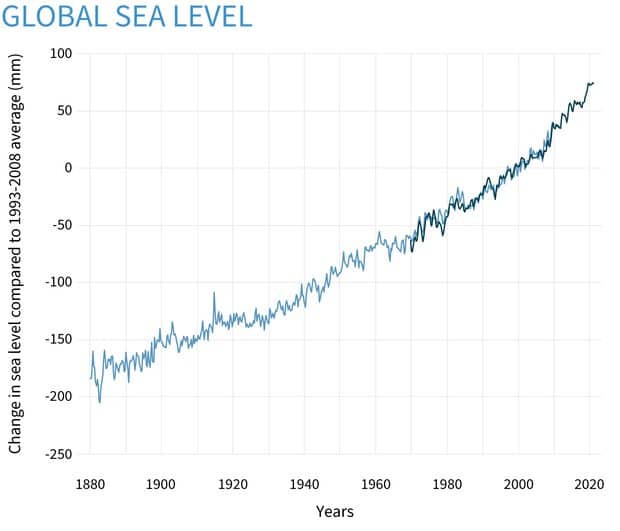
Global sea level since 1880. Image via climate.gov.
Increasing Atmospheric CO2
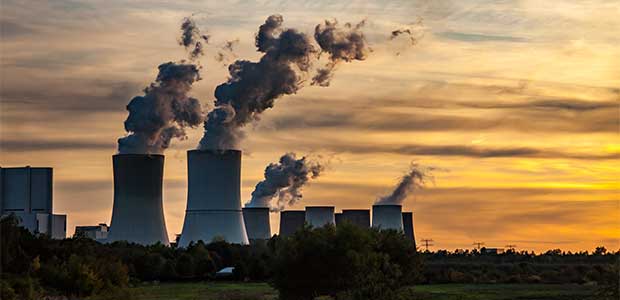
One of the biggest indicators of our contribution to climate change is carbon dioxide, or CO2. It’s clear that human activities, mostly burning fossil fuels, have resulted in an increased concentration of CO2 in our atmosphere. As a result, the natural greenhouse effect of the earth is amplified. According to Time, “The volume of CO2 in the atmosphere stood at 315 ppm when first measured at Mauna Loa Observatory in 1958.” In 2019, it measured at 410 ppm. In 2020, we hit 412.5 ppm, a record high despite the stay-at-home orders and decreased travel of the pandemic.
While the ocean can absorb some of the CO2, about half of all the CO2 we’ve emitted since 1850 still remains in the atmosphere. The terrestrial biosphere, things like plants and trees, can also absorb CO2, but their effects are essentially canceled out when you factor in the cumulative CO2 emissions from land use changes, like deforestation, from 1850 to 2018.
CO2 levels are higher today than at any given point in the last 800,000 years, a period in which we know of previous climate warming and cooling. The highest concentration point during this time frame was about 300,000 years ago, when CO2 reached 300 ppm. We’re projected to double our CO2 levels by 2075, which will put us at levels of CO2 that we haven’t seen in 35 million years. The last time atmospheric CO2 was at these levels, Antarctica was ice-free. It would be the same as the Jurrasic era’s extreme hothouse conditions.
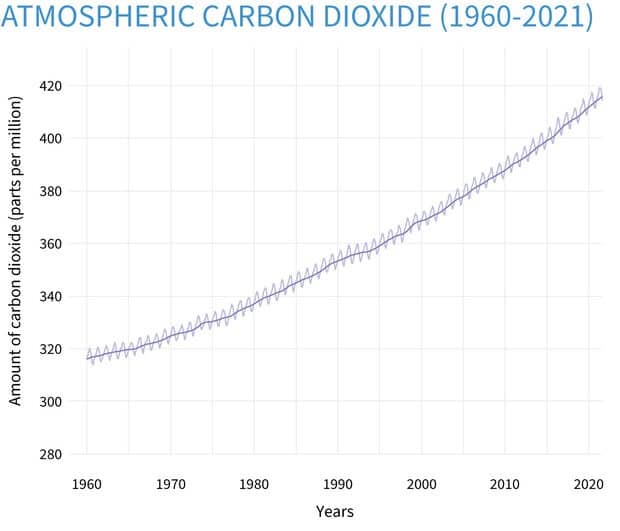
Atmospheric carbon dioxide since 1960. Image via climate.gov.
Global Temperature Change
The temperature on the earth can vary widely – for example, at any given time, the lowest and highest temperatures are more than 100 degrees Fahrenheit (55 degrees Celsius) apart. But finding a global average temperature and tracking it is essential for tracking changes in our temperature and energy budget. Considering the heat capacity of our planet’s oceans, it takes a huge amount of heat energy to raise our surface temperature, even by just a tiny amount.
Between 1880 and 1981, the earth’s temperature rose 0.14 degrees Fahrenheit each decade. Since 1981, that rate has doubled to 0.32 degrees. While the average temperature of the land and oceans was 57 degrees, that number jumped to 58.76 degrees by 2020 – a total of 2.14 degrees Fahrenheit warmer than pre-industrial times. With that in mind, it’s no surprise that we’ve experienced the 10 warmest years on record since 2005. Despite the pandemic, 2020 was the second warmest year ever recorded.
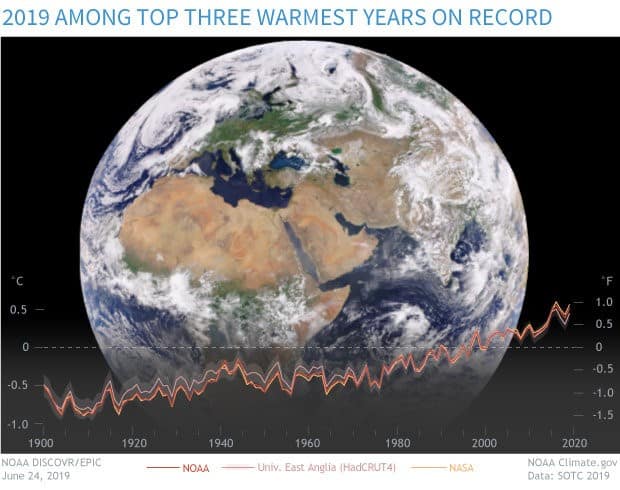
Global temperature change since 1900. Image via climate.gov.
What Does the Future Look Like With Climate Change?
Looking back at our impact on climate change since the Industrial Revolution, we’re left with a bleak picture. Sea levels are rising, arctic sea ice is melting, CO2 emissions are increasing, and the temperature is steadily climbing. Worse still, all of these things are happening at an increasingly faster rate. This leads us to ask one question: what happens if we continue down this route – what will the earth look like?
Our environment is interconnected, and we’ve already seen the domino effect that global warming can have. For example, our increase in atmospheric CO2 means that the ocean (which absorbs as much as one-third of atmospheric CO2) has absorbed enough CO2 to increase its acidity by 30%. (Lindsey, 2020) This is, in part, the reason that we’ve lost about 14% of the world’s coral reefs since 2010. If we continue on, we could lose more than 90% by 2050. Although reefs exist in less than one percent of the ocean, they’re home to almost a quarter of all ocean species. (2021) Losing these habitats would have dire impacts on the rest of the ocean ecosystem.
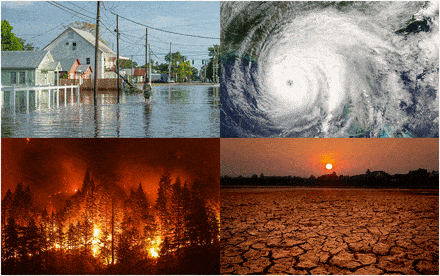
Effects of climate change
We also know that the ice sheets are melting, which will greatly impact how our future looks. Not only does this directly impact polar bears who depend on the ice sheets as part of their habitat, but it will impact people around the world. According to Nasa, “Recent satellite observations have detected a thinning of parts of the Greenland ice sheet at lower elevations. A partial melting of this ice sheet would cause a 1-meter (3-foot) rise. If melted completely, the Greenland ice sheet contains enough water to raise sea level by 5-7 meters (16-23 feet).” (Interactives – Climate Change: Vital Signs of the planet) Even with a moderate estimate of a 19.7-foot sea level increase, Miami and New Orleans would be underwater in the U.S. In Europe, Amsterdam would be submerged, as well as Georgetown and Macapa in the Amazon Delta. The people and animals in these cities would be displaced.
Warming water temperatures also tell us that we can expect more frequent, rainier hurricanes and more flooding on land. Separately, warmer weather will dry out land and the risk of deadly wildfires also increases. Wildfire season will last even into what was once the rainy season. We’ll see extremes in cold weather events as well. Polar-vortex events are occurring as much as 140% more frequently over the last four decades and will continue to increase.
Climate change and major changes to our daily lives
As awful as these facts sound, the effects of climate change can still feel impossible. These large-scale changes are happening right now, but the average person isn’t seeing their effects with their own eyes. So what would your life be like if things continue as is? As soon as 2050, you may have to check the air quality before you even open a window, as air pollution continues to increase. Going outside would require a mask, though your eyes would still water. You might have to pay to use water in public restrooms. Temperatures in some areas could reach 140 degrees Fahrenheit for an entire month every year.
Even if we limit warming to somewhere between 1.5 and 2 degrees Celsius, we’ll still see major changes to our daily lives. Tropic summers would have a 50% increase in days of extreme heat by 2050. Soil moisture in central and western U.S. will decrease, which would worsen heat waves and increase the number of extreme heat days each year. Sea levels would still rise two to three feet and displace about four million people. If we go beyond two degrees of warming, we could see over 700 million refugees displaced by the rising seas. The same sea level rise would threaten the lives of 233 federally protected plant and animal species, like the loggerhead sea turtle and Hawaiian monk seal, in the U.S. alone.
Ultimately, if we do nothing about climate change, the future is grim. We’ll experience record high temperatures, frequent natural disasters, and lose valuable animal and plant species. Cities will disappear into the oceans and millions of people will be displaced. The precarious balance of the human population and animal ecosystems will be completely lost. Daily life will involve remaining indoors, wearing masks outside, and a struggle to find water.
Whose Problem Is It?
Despite the dire situation, many people still have a “not my problem” attitude. As a singular person, it’s easy to say big corporations should shoulder more responsibility. Corporations prioritize profit over the environment, and governments argue about what country is to blame. While we argue and negotiate, the effects of climate change are worsening. It’s becoming everyone’s problem, whether we like it or not. Worse still, it’s disproportionately impacting poor and marginalized communities, which have the least resources to deal with the aftermath.
This year, scientists mapped out temperatures in New York City and 11 other cities. They’re gathering data to learn more about how temperatures differ from street to street in urban areas. What they found backed up what was already known – urban areas generate heat. However, the extreme differences were shocking. The South Bronx (one of the poorest neighborhoods) was seven degrees hotter than the Upper East Side of Manhattan (one of the wealthiest). Central Park had a 10-degree difference from South Bronx. As we continue to feel the effects of global warming, we expect more people to move to these urban areas – the share of urban dwellers will increase from today’s 55% to 68% in 2050.
Corporations and the effect of climate change
The same can be said around the world, as more extreme weather disproportionately impacts marginalized people and less developed nations. It’s no longer a question of whose problem it is – it is everyone’s problem. Every nation, and especially rich nations, must find the money to deal with the results of climate change and begin drastically reducing carbon output. Corporations must lower their CO2 emissions and support employees dealing with the effects of climate change. On a singular level, people must also do their part and lower their personal footprint. Only when we all work together can we stop ice caps from melting, sea levels from rising, and temperatures from skyrocketing. We must use the well-documented history of climate change to drive our action today. Only then can we save the planet.
Learning Hub @GBRIonline provides you access to 100s of sustainability, green building and LEED courses.
To learn more about click here in link for our course on Climate Change: Not My Problem (But Whose Is It?)